

從零散的用戶回饋,迭代出對的功能
Paddi 是一個 AI 產品經理,將零散的用戶回饋轉化為開發者與 Coding Agent 都能直接實作的清晰規格
Current state
The API's calculateHealthScore currently calculates the raw value, 0–100 normalized value, weight, and weighted contribution for six signals: usage frequency, seat utilization, open tickets, NPS score, contract value, and login recency. apps/web/src/app/customers/[id]/page.tsx displays these fields in the Customer Detail Score breakdown table, but lists the values only in the existing signal order and does not indicate which factors are lowering or raising the total score. CSMs must therefore interpret the normalized values and contributions themselves, making it difficult to identify customer risks quickly.
packages/types/src/health-score.ts already includes the calculation results needed to build an explanation, and the API customer health-score response returns signals directly. This improvement should reuse those results rather than change the health score formula. The existing score-tier thresholds remain Healthy ≥ 75, At Risk ≥ 50, and Critical < 50.
Goal
Provide a prominent, standalone Risk drivers summary on Customer Detail so that CSMs can immediately understand the primary downward and upward factors behind a customer's score while still being able to review the signal values, weights, and contributions supporting the explanation.
Success criteria:
- Clearly label every displayed driver as either a downward contributor or an upward contributor.
- Prioritize items by the magnitude of their weighted contribution; do not introduce undecided thresholds, baselines, or external data models.
- Use the same API-calculated results as the existing Score breakdown so the summary and total score cannot diverge.
- Let CSMs identify the most important upward and downward factors without manually comparing six rows of numbers. This feature provides explanation only; it does not create tasks, timeline events, customer contacts, or other workflow actions.
Proposal
- 1.Add a standalone
Cardto the main customer-detail content area inapps/web/src/app/customers/[id]/page.tsx. Place it near the existing Health score trend and Score breakdown so it is the primary interpretation area after the score is viewed. The title may be Risk drivers, with a subtitle explaining that the content is based on the current Score breakdown calculations. - 2.Create presentation-only groups from the
signalsarray in the health-score response:- Downward contributors: signals where
normalizedValue < 50. Sort them byweightedContributionfrom lowest to highest; a lower contribution represents a greater downward effect on the total score. - Upward contributors: signals where
normalizedValue >= 50. Sort them byweightedContributionfrom highest to lowest; a higher contribution represents stronger support for the total score.
- Downward contributors: signals where
- 3.This grouping rule uses only the existing normalized values and contributions. It must not modify the calculator, weights, or score/tier calculations. To avoid incorrectly labeling a signal at exactly 50 as a risk, include 50 in the upward group and use neutral wording in the UI; do not claim that it is a risk.
- 4.Display both upward and downward contributors in the summary, with no more than two items per group to preserve scanability. If a group has no items, show an explicit empty state such as
No significant downward contributorsorNo significant upward contributorsrather than leaving it blank. - 5.Each driver row/card must include: a human-readable signal label, direction (
Pulling score down/Supporting score), raw value, normalized value, weight, and weighted contribution. Use consistent and accessible warning/danger visual treatment for downward items and success/positive treatment for upward items. Direction must not be communicated by color alone; it must include text or another readable marker. - 6.Add concise explanatory copy stating that the ordering is based on the current weighted contribution and that this section explains the score rather than recommending follow-up actions. Do not add threshold-based claims such as "below target," causal inferences, risk probabilities, or automatic recommendations.
- 7.Keep the complete existing Score breakdown table so CSMs can still inspect all six signals and their details. The summary is a prioritized overview, not a replacement for the table. A pure function or shared presenter may be extracted for grouping and sorting, with unit tests, to keep product logic out of JSX.
- 8.Adjust the shared contract only if the API response cannot support the UI.
SignalContributionis currently sufficient, so do not add persistence fields or an API route by default. Centralize any new labels or descriptions and reuse the existingSIGNAL_LABELSso naming remains consistent between the summary and breakdown.
Risks / trade-offs
- Using normalized value 50 as the positive/negative boundary is an explainable product rule that requires no new data, but it is not a business-risk threshold. The UI must avoid describing every signal below 50 as definitive customer churn risk.
- Sorting only by weighted contribution reflects each signal's impact on the current total score, but does not represent recent trends, causal relationships, or the best action for a CSM. These are explicitly out of scope.
- Limiting each group to two items reduces information load but may hide other signals. The complete table must remain available for inspection.
- Null or missing synchronization data must continue to be presented according to the calculator's existing output; the frontend must not guess or fabricate raw values. If a contribution is 0, use neutral or appropriate empty/low-impact wording and do not exaggerate risk.
- Any difference between the grouping and the existing Score breakdown numbers would damage trust. Use the same response, consistent number formatting, and tests to guarantee consistency.
Acceptance criteria
- When any Customer Detail is opened, a standalone Risk drivers summary is visible near Score breakdown without navigating to the customer list or another page.
- The summary provides both downward and upward contributor sections; each section displays no more than two items and shows an explicit empty state when it has no items.
- Downward items are determined by
normalizedValue < 50and sorted byweightedContributionfrom lowest to highest; upward items are determined bynormalizedValue >= 50and sorted byweightedContributionfrom highest to lowest. - Each summary item displays the signal label, direction text, raw value, normalized value, weight, and weighted contribution, with values exactly matching the existing Score breakdown.
- Positive and negative directions have text or semantic markers and do not rely on color alone; they remain distinguishable in dark mode and for keyboard and screen-reader users.
- The summary does not change health score, tier, weights, normalization, API calculations, or database snapshot behavior.
- The existing complete Score breakdown table remains and still contains all six signals and its original fields.
- The summary does not provide actions to create tasks, create timeline events, contact customers, or trigger other workflows; it is limited to explaining the current score.
- Automated tests cover grouping, sorting, the two-item limit, empty groups, and the boundary value
normalizedValue = 50; existing health-score calculator tests and web typecheck/build pass.
Make health scores explainable so CSMs can act on them
The health score surfaces a number and a tier but nothing about what's driving it, so CSMs either distrust it or misread it.
The health-score calculator already computes per-signal normalized values, weights, and weighted contributions, but none of this is exposed in the customer view: apps/web/src/app/customers/[id]/page.tsx renders the six signals in a flat table in fixed order, with no indication of which factors pull the score down or hold it up. The interpretation burden therefore falls entirely on the CSM, who must compare six rows of raw and normalized numbers by hand to understand a single score — which is why a Critical account that recently renewed reads as contradictory rather than informative. The gap is in the presentation layer, not the scoring logic: calculator.ts and weights.ts already produce everything needed to rank and label drivers, and packages/types/src/health-score.ts already carries the SignalContribution fields, so an explanation can be built by reusing existing calculation output without touching the formula, thresholds, or API contract. The affected surface is customer-detail rendering; the health-score calculation, weights, and tier logic are unchanged.
Paddi 將原始用戶回饋轉化為可直接開發的規格,
過程中的每個決策都有你的代碼庫與文件作為依據
來自各處的訊號,一個都不漏
串接回饋所在的來源,或透過內建方式手動新增。
Paddi 會把相關回饋分群,整理成結構化的需求。
 Slack
Slack找出每個需求背後真正的問題
需求本身,只告訴你用戶提了什麼。Paddi 會從你的程式碼與產品知識中調取證據,挖出需求背後真正的問題,再圍繞這個問題重新框定需求
'%3e%3cpath%20d='M41.4395%2069.3848C28.8066%2067.8535%2019.9062%2058.7617%2019.9062%2046.9902C19.9062%2042.2051%2021.6289%2037.0371%2024.5%2033.5918C23.2559%2030.4336%2023.4473%2023.7344%2024.8828%2020.959C28.7109%2020.4805%2033.8789%2022.4902%2036.9414%2025.2656C40.5781%2024.1172%2044.4062%2023.543%2049.0957%2023.543C53.7852%2023.543%2057.6133%2024.1172%2061.0586%2025.1699C64.0254%2022.4902%2069.2891%2020.4805%2073.1172%2020.959C74.457%2023.543%2074.6484%2030.2422%2073.4043%2033.4961C76.4668%2037.1328%2078.0937%2042.0137%2078.0937%2046.9902C78.0937%2058.7617%2069.1934%2067.6621%2056.3691%2069.2891C59.623%2071.3945%2061.8242%2075.9883%2061.8242%2081.252L61.8242%2091.2051C61.8242%2094.0762%2064.2168%2095.7031%2067.0879%2094.5547C84.4102%2087.9512%2098%2070.6289%2098%2049.1914C98%2022.1074%2075.9883%206.69539e-07%2048.9043%204.309e-07C21.8203%201.92261e-07%20-1.9479e-07%2022.1074%20-4.3343e-07%2049.1914C-6.20631e-07%2070.4375%2013.4941%2088.0469%2031.6777%2094.6504C34.2617%2095.6074%2036.75%2093.8848%2036.75%2091.3008L36.75%2083.6445C35.4102%2084.2188%2033.6875%2084.6016%2032.1562%2084.6016C25.8398%2084.6016%2022.1074%2081.1563%2019.4277%2074.7441C18.375%2072.1602%2017.2266%2070.6289%2015.0254%2070.3418C13.877%2070.2461%2013.4941%2069.7676%2013.4941%2069.1934C13.4941%2068.0449%2015.4082%2067.1836%2017.3223%2067.1836C20.0977%2067.1836%2022.4902%2068.9063%2024.9785%2072.4473C26.8926%2075.2227%2028.9023%2076.4668%2031.2949%2076.4668C33.6875%2076.4668%2035.2187%2075.6055%2037.4199%2073.4043C39.0469%2071.7773%2040.291%2070.3418%2041.4395%2069.3848Z'%20fill='white'/%3e%3c/g%3e%3cdefs%3e%3cclipPath%20id='clip0_730_27136'%3e%3crect%20width='98'%20height='96'%20fill='white'/%3e%3c/clipPath%3e%3c/defs%3e%3c/svg%3e) GitHub
GitHub GitLab
 Jira
Jira'%20d='M9.26%20187.33c-2.64%204.307-5.607%209.305-8.126%2013.287a8.127%208.127%200%200%200%202.722%2011.052l52.823%2032.507a8.127%208.127%200%200%200%2011.256-2.763c2.113-3.536%204.835-8.127%207.801-13.044c20.926-34.538%2041.974-30.312%2079.925-12.19l52.376%2024.908a8.127%208.127%200%200%200%2010.93-4.063l25.152-56.886a8.127%208.127%200%200%200-4.063-10.646c-11.052-5.201-33.034-15.562-52.823-25.111c-71.189-34.579-131.691-32.344-177.972%2042.949'/%3e%3cpath%20fill='url(%23SVGgker3cTp)'%20d='M246.115%2058.232c2.641-4.307%205.607-9.305%208.127-13.287a8.127%208.127%200%200%200-2.723-11.052L198.696%201.386a8.127%208.127%200%200%200-11.58%202.682c-2.113%203.535-4.835%208.127-7.802%2013.043c-20.926%2034.538-41.974%2030.313-79.925%2012.19L47.176%204.515a8.127%208.127%200%200%200-10.93%204.063L11.093%2065.465a8.127%208.127%200%200%200%204.063%2010.645c11.052%205.202%2033.035%2015.563%2052.823%2025.112c71.351%2034.538%20131.854%2032.222%20178.135-42.99'/%3e%3c/svg%3e) Confluence
Confluence'%3e%3cpath%20fill-rule='evenodd'%20clip-rule='evenodd'%20d='M7.6285%200.0273077L0.9735%200.517308C0.437%200.563808%200.25%200.914808%200.25%201.33331V8.61281C0.25%208.93981%200.3665%209.21931%200.647%209.59281L2.2115%2011.6228C2.468%2011.9493%202.7015%2012.0198%203.1925%2011.9953L10.921%2011.5293C11.5745%2011.4828%2011.7615%2011.1793%2011.7615%2010.6658V2.47681C11.7615%202.21181%2011.6565%202.13481%2011.347%201.90931L11.294%201.87031L9.17%200.377308C8.6565%200.00430772%208.445%20-0.0426923%207.6285%200.0273077ZM3.368%202.34231C2.7365%202.38531%202.5935%202.39481%202.235%202.10381L1.3235%201.37981C1.2305%201.28631%201.2775%201.16981%201.511%201.14681L7.909%200.680308C8.446%200.633308%208.726%200.820308%208.936%200.983308L10.0335%201.77681C10.08%201.80031%2010.1965%201.93981%2010.057%201.93981L3.449%202.33681L3.368%202.34231ZM2.6315%2010.5963V3.64331C2.6315%203.34031%202.725%203.20031%203.0055%203.17681L10.5935%202.73381C10.851%202.71031%2010.9675%202.87381%2010.9675%203.17681V10.0818C10.9675%2010.3863%2010.921%2010.6428%2010.5005%2010.6658L3.239%2011.0858C2.818%2011.1093%202.6315%2010.9703%202.6315%2010.5963ZM9.8005%204.01631C9.847%204.22731%209.8005%204.43731%209.5895%204.46131L9.24%204.53081V9.66281C8.936%209.82631%208.656%209.91931%208.4225%209.91931C8.049%209.91931%207.9555%209.80331%207.675%209.45331L5.387%205.86081V9.33681L6.111%209.50031C6.111%209.50031%206.111%209.92031%205.5265%209.92031L3.916%2010.0133C3.869%209.91981%203.916%209.68631%204.0795%209.63981L4.4995%209.52381V4.92631L3.916%204.87981C3.8695%204.66981%203.986%204.36681%204.313%204.34331L6.041%204.22731L8.4225%207.86681V4.64681L7.8155%204.57681C7.7685%204.32031%207.9555%204.13331%208.189%204.11031L9.8005%204.01631Z'%20fill='white'/%3e%3c/g%3e%3cdefs%3e%3cclipPath%20id='clip0_11708_3960'%3e%3crect%20width='12'%20height='12'%20fill='white'/%3e%3c/clipPath%3e%3c/defs%3e%3c/svg%3e) Notion
Notion Google Drive
把最重要的排在最前面
Paddi 會以四個維度為每個需求評分,其中包含該需求與你設定的產品商業目標契合程度。一旦調整你的產品目標設定,排序就會重新計算。
檢視分析,選定方向
由你檢視 Paddi 的完整分析,接著從它整理出的解法路徑中挑選,或輸入自己的想法。Paddi 會從你的選擇中了解功能應該怎麼做、改動範圍有多大。
AI 起草規格,由你收斂細節
Paddi 會把你的決策,產出成完整規格。在內建的 Markdown 編輯器中與 Paddi 一起打磨細節,直到它正是你想交付的樣子。
用團隊最習慣的方式交付
複製完整規格、分享檢視連結,或匯出到你現有的協作工具中。不管你的團隊怎麼運作,規格都能順暢交付。
JiraNotion給 Agent 與開發者
直接進入 Coding Agent 與開發者原本工作的環境
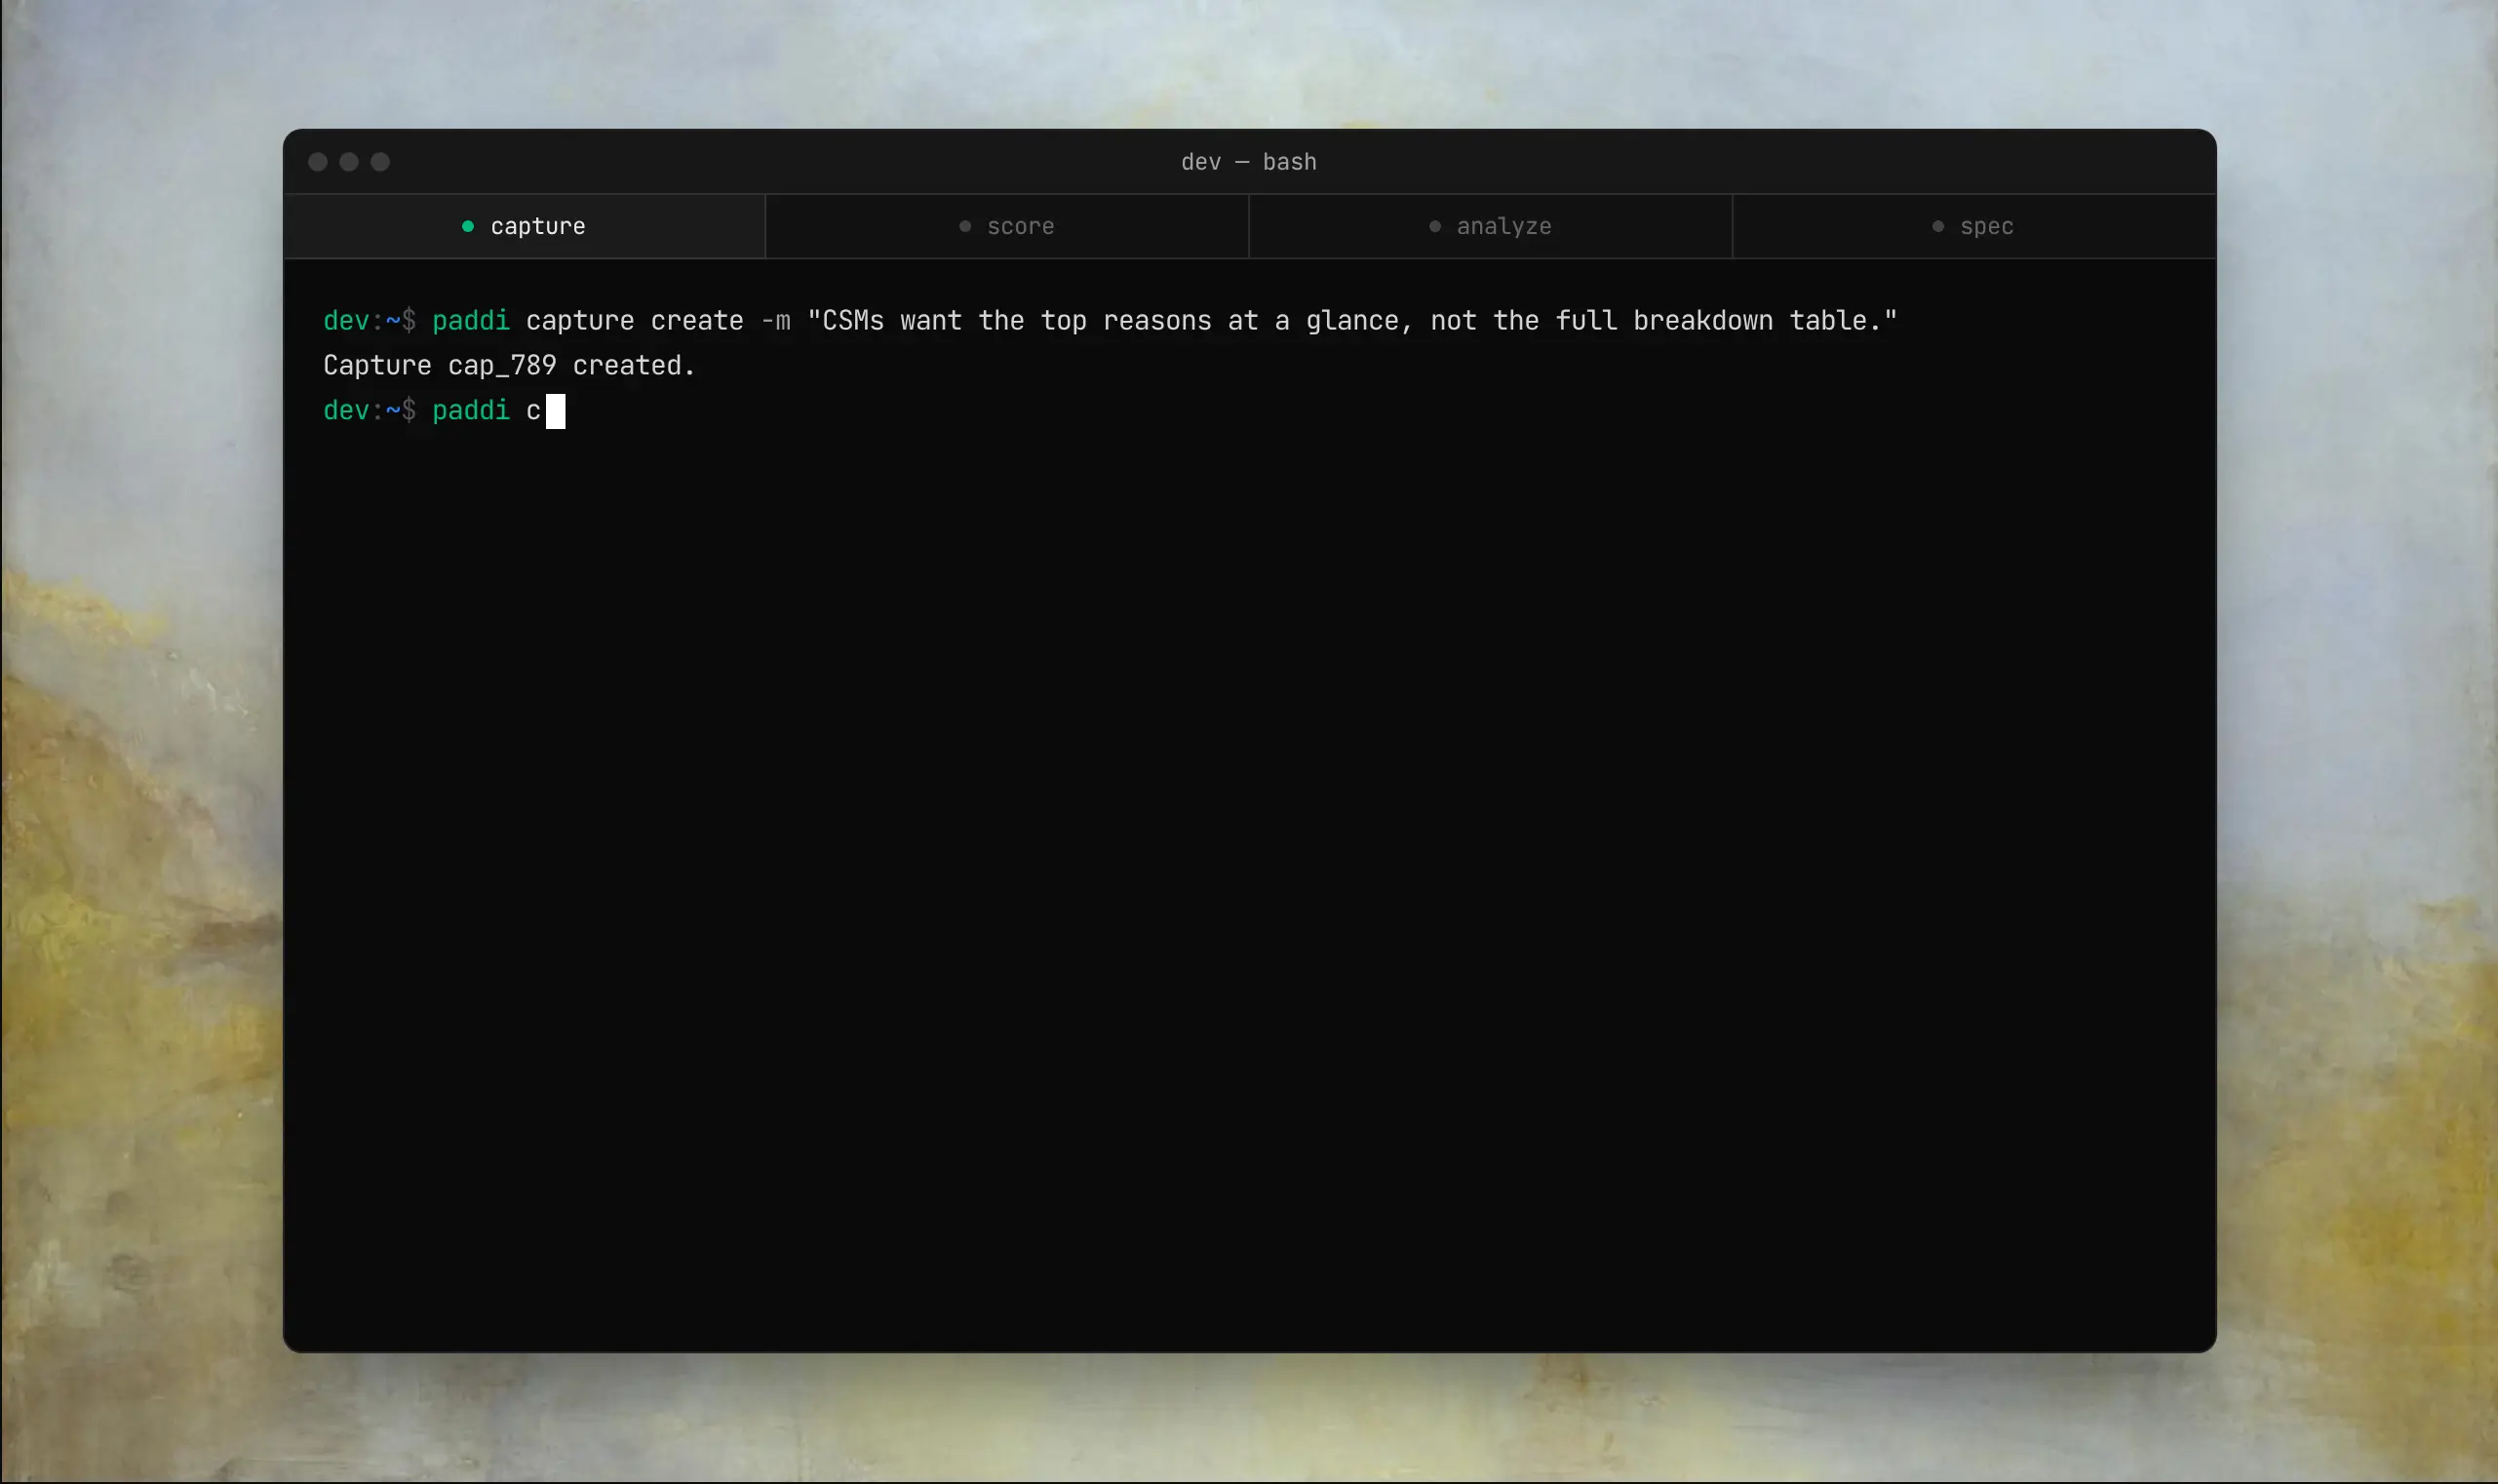

npx paddi透過 CLI,直接在終端機拉下任一份規格,不必來回切換視窗,也不用等人交接。
將 Paddi 作為 skill 運行,Coding Agent 就能自己取得需要的規格,直接開工。
給團隊
問 Paddi 任何有關規格的問題
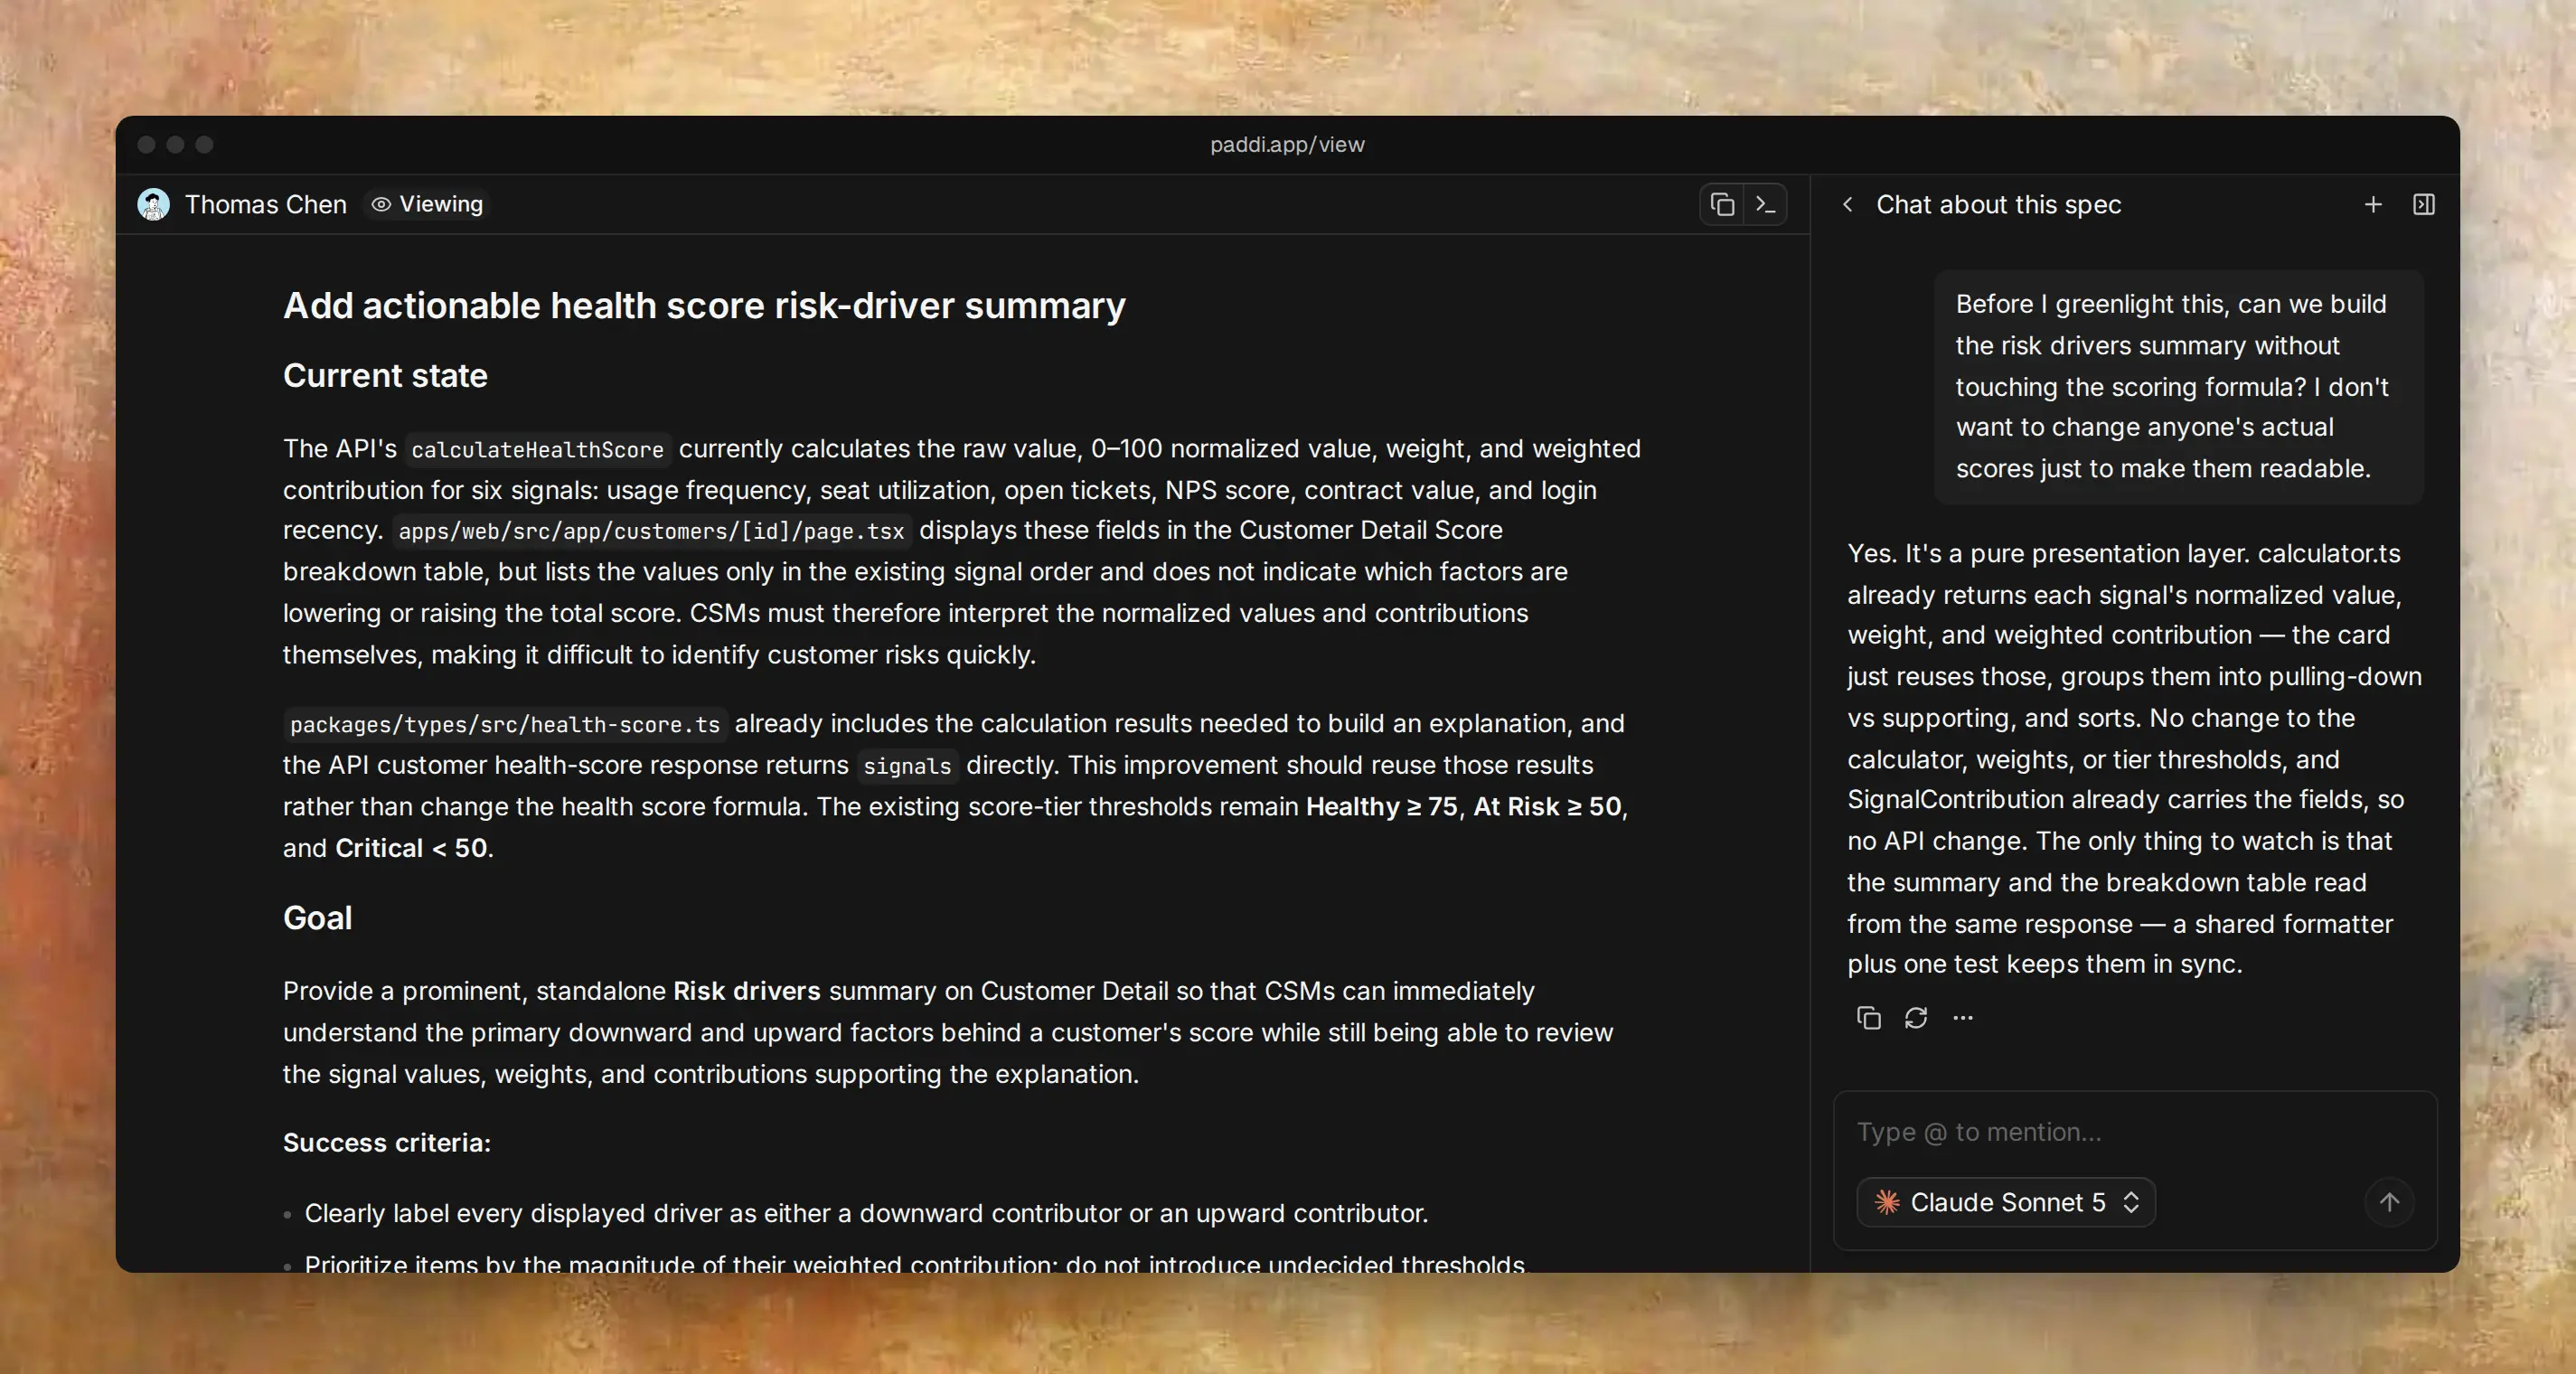

Current state
The API's calculateHealthScore currently calculates the raw value, 0–100 normalized value, weight, and weighted contribution for six signals: usage frequency, seat utilization, open tickets, NPS score, contract value, and login recency. apps/web/src/app/customers/[id]/page.tsx displays these fields in the Customer Detail Score breakdown table, but lists the values only in the existing signal order and does not indicate which factors are lowering or raising the total score. CSMs must therefore interpret the normalized values and contributions themselves, making it difficult to identify customer risks quickly.
packages/types/src/health-score.ts already includes the calculation results needed to build an explanation, and the API customer health-score response returns signals directly. This improvement should reuse those results rather than change the health score formula. The existing score-tier thresholds remain Healthy ≥ 75, At Risk ≥ 50, and Critical < 50.
Goal
Provide a prominent, standalone Risk drivers summary on Customer Detail so that CSMs can immediately understand the primary downward and upward factors behind a customer's score while still being able to review the signal values, weights, and contributions supporting the explanation.
Success criteria:
- Clearly label every displayed driver as either a downward contributor or an upward contributor.
- Prioritize items by the magnitude of their weighted contribution; do not introduce undecided thresholds, baselines, or external data models.
- Use the same API-calculated results as the existing Score breakdown so the summary and total score cannot diverge.
- Let CSMs identify the most important upward and downward factors without manually comparing six rows of numbers. This feature provides explanation only; it does not create tasks, timeline events, customer contacts, or other workflow actions.
Proposal
- 1.Add a standalone
Cardto the main customer-detail content area inapps/web/src/app/customers/[id]/page.tsx. Place it near the existing Health score trend and Score breakdown so it is the primary interpretation area after the score is viewed. The title may be Risk drivers, with a subtitle explaining that the content is based on the current Score breakdown calculations. - 2.Create presentation-only groups from the
signalsarray in the health-score response:- Downward contributors: signals where
normalizedValue < 50. Sort them byweightedContributionfrom lowest to highest; a lower contribution represents a greater downward effect on the total score. - Upward contributors: signals where
normalizedValue >= 50. Sort them byweightedContributionfrom highest to lowest; a higher contribution represents stronger support for the total score.
- Downward contributors: signals where
- 3.This grouping rule uses only the existing normalized values and contributions. It must not modify the calculator, weights, or score/tier calculations. To avoid incorrectly labeling a signal at exactly 50 as a risk, include 50 in the upward group and use neutral wording in the UI; do not claim that it is a risk.
- 4.Display both upward and downward contributors in the summary, with no more than two items per group to preserve scanability. If a group has no items, show an explicit empty state such as
No significant downward contributorsorNo significant upward contributorsrather than leaving it blank. - 5.Each driver row/card must include: a human-readable signal label, direction (
Pulling score down/Supporting score), raw value, normalized value, weight, and weighted contribution. Use consistent and accessible warning/danger visual treatment for downward items and success/positive treatment for upward items. Direction must not be communicated by color alone; it must include text or another readable marker. - 6.Add concise explanatory copy stating that the ordering is based on the current weighted contribution and that this section explains the score rather than recommending follow-up actions. Do not add threshold-based claims such as "below target," causal inferences, risk probabilities, or automatic recommendations.
- 7.Keep the complete existing Score breakdown table so CSMs can still inspect all six signals and their details. The summary is a prioritized overview, not a replacement for the table. A pure function or shared presenter may be extracted for grouping and sorting, with unit tests, to keep product logic out of JSX.
- 8.Adjust the shared contract only if the API response cannot support the UI.
SignalContributionis currently sufficient, so do not add persistence fields or an API route by default. Centralize any new labels or descriptions and reuse the existingSIGNAL_LABELSso naming remains consistent between the summary and breakdown.
Risks / trade-offs
- Using normalized value 50 as the positive/negative boundary is an explainable product rule that requires no new data, but it is not a business-risk threshold. The UI must avoid describing every signal below 50 as definitive customer churn risk.
- Sorting only by weighted contribution reflects each signal's impact on the current total score, but does not represent recent trends, causal relationships, or the best action for a CSM. These are explicitly out of scope.
- Limiting each group to two items reduces information load but may hide other signals. The complete table must remain available for inspection.
- Null or missing synchronization data must continue to be presented according to the calculator's existing output; the frontend must not guess or fabricate raw values. If a contribution is 0, use neutral or appropriate empty/low-impact wording and do not exaggerate risk.
- Any difference between the grouping and the existing Score breakdown numbers would damage trust. Use the same response, consistent number formatting, and tests to guarantee consistency.
Acceptance criteria
- When any Customer Detail is opened, a standalone Risk drivers summary is visible near Score breakdown without navigating to the customer list or another page.
- The summary provides both downward and upward contributor sections; each section displays no more than two items and shows an explicit empty state when it has no items.
- Downward items are determined by
normalizedValue < 50and sorted byweightedContributionfrom lowest to highest; upward items are determined bynormalizedValue >= 50and sorted byweightedContributionfrom highest to lowest. - Each summary item displays the signal label, direction text, raw value, normalized value, weight, and weighted contribution, with values exactly matching the existing Score breakdown.
- Positive and negative directions have text or semantic markers and do not rely on color alone; they remain distinguishable in dark mode and for keyboard and screen-reader users.
- The summary does not change health score, tier, weights, normalization, API calculations, or database snapshot behavior.
- The existing complete Score breakdown table remains and still contains all six signals and its original fields.
- The summary does not provide actions to create tasks, create timeline events, contact customers, or trigger other workflows; it is limited to explaining the current score.
- Automated tests cover grouping, sorting, the two-item limit, empty groups, and the boundary value
normalizedValue = 50; existing health-score calculator tests and web typecheck/build pass.
工程師會問某個決策會對應到哪段程式碼、有哪些邊緣案例要注意。
設計師會問為什麼這個改動是這樣界定範圍,又是哪些回饋促成的。
任何人來問,都能直接看到每個決策背後的理由,不必再來煩你。
資安防護,貫穿每一步
絕不留存
Paddi 讀取你的程式碼,為分析提供依據,用完即釋放。你的程式碼絕不會被儲存。
絕不用於模型訓練
你的任何資料都不會被用來訓練模型。
傳輸與儲存全程加密
在 Paddi 中傳輸與存放的資料,全部加密。
預備取得 SOC 2 Type II 與 ISO 27001 資安認證
我們從第一天就依照這些標準打造產品,並隨 Paddi 成長取得正式的認證。

成為第一批使用 Paddi 打造產品的團隊
我們正在開放少量名額,尋找願意一起打磨產品的團隊。儘早加入,開始迭代對的功能。